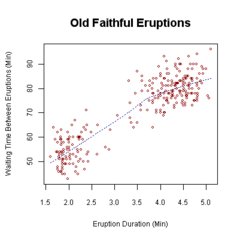
சிதறல் படம்
Appearance
இக்கட்டுரை தமிழாக்கம் செய்யப்பட வேண்டியுள்ளது. இதைத் தொகுத்துத் தமிழாக்கம் செய்வதன் மூலம் நீங்கள் இதன் வளர்ச்சியில் பங்களிக்கலாம். |

சிதறல் படம் (Scatter plot) என்பது ஒரு கணித வரைபடம் ஆகும். இது இரு மாறிகள் கொண்ட ஒரு தரவின் போக்கினைக் குறிக்கும் கார்ட்டீசியன் தள வரைடம். இப்படம் தரவின் இரு மாறிகளுக்கிடையே உள்ள ஒட்டுறவு (correlation) அல்லது தொடர்புப் போக்கைப் (regression) புரிந்துகொள்ளப் பயன்படுகின்றது.[1][2][3]
மேற்கோள்கள்
[தொகு]- ↑ Visualizations that have been created with VisIt at wci.llnl.gov. Last updated: November 8, 2007.
- ↑ Jarrell, Stephen B. (1994). Basic Statistics (Special pre-publication ed.). Dubuque, Iowa: Wm. C. Brown Pub. p. 492. பன்னாட்டுத் தரப்புத்தக எண் 978-0-697-21595-6.
When we search for a relationship between two quantitative variables, a standard graph of the available data pairs (X,Y), called a scatter diagram, frequently helps...
- ↑ Utts, Jessica M. Seeing Through Statistics 3rd Edition, Thomson Brooks/Cole, 2005, pp 166-167. பன்னாட்டுத் தரப்புத்தக எண் 0-534-39402-7
