
படிமம்:Vostok-ice-core-petit.png

Vostok-ice-core-petit.png (598 × 441 படவணுக்கள், கோப்பின் அளவு: 31 KB, MIME வகை: image/png)
| இது விக்கிமீடியா பொதுக்கோப்பகத்தில் இருக்கும் ஒரு கோப்பாகும். இக்கோப்பைக் குறித்து அங்கே காணப்படும் படிம விளக்கப் பக்கத்தை இங்கே கீழே காணலாம்.
|
Template loop detected: Template:Autotranslate <includeonly></includeonly> {{Transferred from|en.wikipedia|Maksim}manikanta}
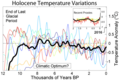
Graph of CO2 (Green graph), temperature (Blue graph), and dust concentration (Red graph) measured from the Vostok, Antarctica ice core as reported by Petit et al., 1999. Higher dust levels are believed to be caused by cold, dry periods.

|
GNU Free Documentation License விதிமுறைகளின் கீழ் இந்த ஆவணத்தை நகலெடுக்க, விநியோகிக்க மற்றும்/அல்லது மாற்றுவதற்கு அனுமதி வழங்கப்பட்டுள்ளது, Free Software Foundation;ஆல் வெளியிடப்பட்ட பதிப்பு 1.2 அல்லது அதற்குப் பிந்தைய பதிப்பு, மாற்றமில்லாத பிரிவுகள், முன் அட்டை உரைகள் மற்றும் பின் அட்டை உரைகள் இல்லாமல் வெளியிடப்பட்டது. GNU Free Documentation License என்ற தலைப்பில் உரிமத்தின் நகல் சேர்க்கப்பட்டுள்ளது. |
| இந்த கோப்பு Creative Commons Attribution-Share Alike 3.0 Unported உரிமத்தின் கீழ் உள்ளது. | ||
| ||
| This licensing tag was added to this file as part of the GFDL licensing update. |
Data from: http://www.ngdc.noaa.gov/paleo/icecore/antarctica/vostok/vostok_data.html
Error: journal= not stated.
Related Images
-
 Comparison of CO2 changes to recent changes
 -
 Additional ice age temperature data
 -
 Longer record of ice ages
 -
 Temperature changes since the end of the last ice age
 -
 Another presentation of Vostok Data
 -
 Comparison of Greenland and Antarctica ice cores


| date/time | username | edit summary |
|---|---|---|
| 12:37, 12 February 2006 | en:User:William M. Connolley | (rv. Its not "hard to see" its impossible to see. There is a point worth discusing here, though) |
| 12:03, 12 February 2006 | en:User:Terjepetersen | |
| 19:36, 5 February 2006 | en:User:Leland McInnes | (<span class="autocomment"><a href="/wiki/Image:Vostok-ice-core-petit.png#Related_Images" title="Image:Vostok-ice-core-petit.png">→</a>Related Images -</span> prettier comparison graph) |
| 19:19, 27 April 2005 | en:User:SEWilco | (Explain interest in dust levels) |
| 04:46, 27 April 2005 | en:User:Dragons flight | (related images.) |
| 04:32, 27 April 2005 | en:User:64.161.25.248 | (update text) |
| 04:00, 4 June 2004 | en:User:Template namespace initialisation script | |
| 08:47, 5 May 2004 | en:User:William M. Connolley | (Axes!) |
| 08:44, 5 May 2004 | en:User:William M. Connolley | (Add info) |
| 08:40, 5 May 2004 | en:User:William M. Connolley | (Graph of Vostok CO2/T/dust from Petit paper) |
Original upload log
Legend: (cur) = this is the current file, (del) = delete this old version, (rev) = revert to this old version.
Click on date to download the file or see the image uploaded on that date.
- (del) (cur) 04:24, 27 April 2005 . . en:User:Dragons_flight Dragons flight ( en:User_talk:Dragons_flight Talk) . . 598x441 (31557 bytes) (Prettier Version of Data)
- (del) (rev) 08:40, 5 May 2004 . . en:User:William_M._Connolley William M. Connolley ( en:User_talk:William_M._Connolley Talk) . . 586x207 (7154 bytes) (Graph of Vostok CO2/T/dust from Petit paper)
derivative works
Derivative works of this file: Vostok Petit data.svg
கோப்பின் வரலாறு
குறித்த நேரத்தில் இருந்த படிமத்தைப் பார்க்க அந்நேரத்தின் மீது சொடுக்கவும்.
| நாள்/நேரம் | நகம் அளவு சிறுபடம் | அளவுகள் | பயனர் | கருத்து | |
|---|---|---|---|---|---|
| தற்போதைய | 20:38, 15 பெப்பிரவரி 2006 | | 598 × 441 (31 KB) | Maksim | La bildo estas kopiita de wikipedia:en. La originala priskribo estas: Graph of CO<sub>2</sub>, temperature, and dust concentration measured from the Vostok, Antarctica ice core as reported by Petit et al., 1999. Higher dus |
கோப்பு பயன்பாடு
பின்வரும் 3 பக்கங்கள் இணைப்பு இப் படிமத்துக்கு இணைக்கபட்டுள்ளது(ளன):
கோப்பின் முழுமையான பயன்பாடு
கீழ்கண்ட மற்ற விக்கிகள் இந்த கோப்பை பயன்படுத்துகின்றன:
- af.wikipedia.org-திட்டத்தில் இதன் பயன்பாடு
- ar.wikipedia.org-திட்டத்தில் இதன் பயன்பாடு
- bn.wikipedia.org-திட்டத்தில் இதன் பயன்பாடு
- bs.wikipedia.org-திட்டத்தில் இதன் பயன்பாடு
- ca.wikipedia.org-திட்டத்தில் இதன் பயன்பாடு
- da.wikipedia.org-திட்டத்தில் இதன் பயன்பாடு
- en.wikipedia.org-திட்டத்தில் இதன் பயன்பாடு
- eo.wikipedia.org-திட்டத்தில் இதன் பயன்பாடு
- gl.wikipedia.org-திட்டத்தில் இதன் பயன்பாடு
- gu.wikipedia.org-திட்டத்தில் இதன் பயன்பாடு
- he.wikipedia.org-திட்டத்தில் இதன் பயன்பாடு
- hr.wikipedia.org-திட்டத்தில் இதன் பயன்பாடு
- hu.wikipedia.org-திட்டத்தில் இதன் பயன்பாடு
- ja.wikipedia.org-திட்டத்தில் இதன் பயன்பாடு
- kn.wikipedia.org-திட்டத்தில் இதன் பயன்பாடு
- ko.wikipedia.org-திட்டத்தில் இதன் பயன்பாடு
- nn.wikipedia.org-திட்டத்தில் இதன் பயன்பாடு
- sh.wikipedia.org-திட்டத்தில் இதன் பயன்பாடு
- sl.wikipedia.org-திட்டத்தில் இதன் பயன்பாடு
- sq.wikipedia.org-திட்டத்தில் இதன் பயன்பாடு
- test.wikipedia.org-திட்டத்தில் இதன் பயன்பாடு
- th.wikipedia.org-திட்டத்தில் இதன் பயன்பாடு
- vi.wikipedia.org-திட்டத்தில் இதன் பயன்பாடு
சிறப்பு பக்கம்-மொத்த பயன்பாடு - இதன் மூலம் இந்த கோப்பின் மொத்த பயன்பாட்டை அறிய முடியும்