
படிமம்:07 July - Percent of global area at temperature records - Global warming - NOAA.svg

Size of this PNG preview of this SVG file: 800 × 560 படப்புள்ளிகள். மற்ற பிரிதிறன்கள்: 320 × 224 படப்புள்ளிகள் | 640 × 448 படப்புள்ளிகள் | 1,024 × 717 படப்புள்ளிகள் | 1,280 × 896 படப்புள்ளிகள் | 2,560 × 1,792 படப்புள்ளிகள் | 1,000 × 700 படப்புள்ளிகள் .
மூலக்கோப்பு (SVG கோப்பு, பெயரளவில் 1,000 × 700 பிக்சல்கள், கோப்பு அளவு: 5 KB)
| இது விக்கிமீடியா பொதுக்கோப்பகத்தில் இருக்கும் ஒரு கோப்பாகும். இக்கோப்பைக் குறித்து அங்கே காணப்படும் படிம விளக்கப் பக்கத்தை இங்கே கீழே காணலாம்.
|
சுருக்கம்
| விளக்கம் |
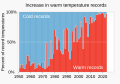
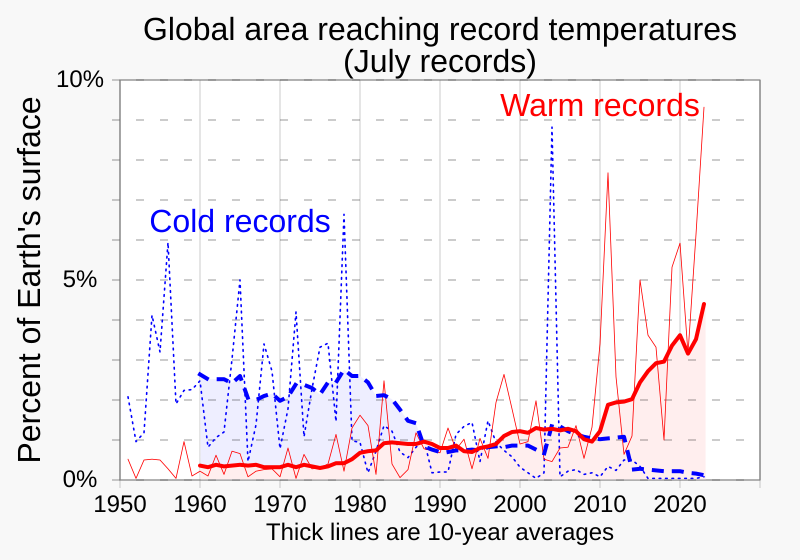
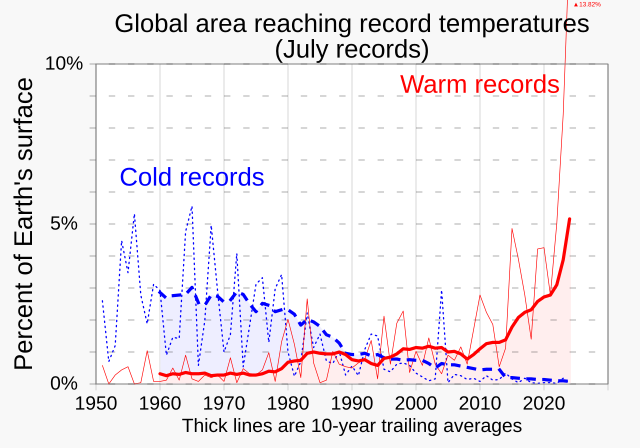
English: Line graphs of the percentages of Earth's surface reaching a record July temperature as a function of time over years 1951-, from NOAA data.
|
||
| நாள் | |||
| மூலம் | சொந்த முயற்சி | ||
| ஆசிரியர் | RCraig09 |

Related files
-
 01 January - Percent of global area at temperature records - Global warming - NOAA.svg
(January data) -
 02 February - Percent of global area at temperature records - Global warming - NOAA.svg
(February data) -
 03 March - Percent of global area at temperature records - Global warming - NOAA.svg
(March data) -
 04 April - Percent of global area at temperature records - Global warming - NOAA.svg
(April data) -
 05 May - Percent of global area at temperature records - Global warming - NOAA.svg
(May data) -
 06 June - Percent of global area at temperature records - Global warming - NOAA.svg
(June data)


-
 07 July - Percent of global area at temperature records - Global warming - NOAA.svg
(July data) -
 08 August - Percent of global area at temperature records - Global warming - NOAA.svg
(August data) -
 09 September - Percent of global area at temperature records - Global warming - NOAA.svg
(September data) -
 10 October - Percent of global area at temperature records - Global warming - NOAA.svg
(October data) -
 11 November - Percent of global area at temperature records - Global warming - NOAA.svg
(November data) -
 12 December - Percent of global area at temperature records - Global warming - NOAA.svg
(December data)


-
 1951+ Percent of global area at temperature records - Seasonal comparison - NOAA.svg
Seasonal comparison -
 1951 - Percent of global area at temperature records (monthly) - Global warming - NOAA.svg
All months scatterplot/dot plot -
 1951- RATIO of new record warm temperatures to new record cold temperatures (monthly) - Global warming.svg
Ratios scatterplot/dot plot (monthly) -
 1951- Percent of record temperatures that are cold or warm records.svg
 -
 1951- Warm and cold record temperatures - bar chart.svg

_-_Global_warming_-_NOAA.svg)
_-_Global_warming.svg)


அனுமதி
இந்த ஆக்கத்தின் காப்புரிமையாளரான நான் இதனைப் பின்வரும் உரிமத்தின் கீழ் வெளியிடுகின்றேன்:
This file is licensed under the Creative Commons Attribution-Share Alike 4.0 International license.
- நீங்கள் சுதந்திரமாக:
- பகிர்ந்து கொள்ள – வேலையை நகலெடுக்க, விநியோகிக்க மற்றும் அனுப்ப
- மீண்டும் கலக்க – வேலைக்கு பழகிக்கொள்ள.
- கீழ்க்காணும் விதிகளுக்கு ஏற்ப,
- பண்புக்கூறுகள் – நீங்கள் பொருத்தமான உரிமையை வழங்க வேண்டும், உரிமத்திற்கான இணைப்பை வழங்க வேண்டும் மற்றும் மாற்றங்கள் செய்யப்பட்டிருந்தால் குறிப்பிட வேண்டும். நீங்கள் ஏற்புடைய எந்த முறையிலும் அவ்வாறு செய்யலாம், ஆனால் எந்த வகையிலும் உரிமதாரர் உங்களை அல்லது உங்கள் பயன்பாட்டிற்கு ஒப்புதல் அளிக்கும் படி பரிந்துரைக்க கூடாது.
- அதே மாதிரி பகிர் – நீங்கள் ரீமிக்ஸ் செய்தாலோ, உருமாற்றம் செய்தாலோ அல்லது பொருளை உருவாக்கினாலோ, உங்கள் பங்களிப்புகளை அல்லது இணக்கமான உரிமம் கீழ் அசலாக விநியோகிக்க வேண்டும்.
கோப்பின் வரலாறு
குறித்த நேரத்தில் இருந்த படிமத்தைப் பார்க்க அந்நேரத்தின் மீது சொடுக்கவும்.
| நாள்/நேரம் | நகம் அளவு சிறுபடம் | அளவுகள் | பயனர் | கருத்து | |
|---|---|---|---|---|---|
| தற்போதைய | 03:42, 15 ஆகத்து 2023 | | 1,000 × 700 (5 KB) | RCraig09 | Version 20: update to include data through July 2023 |
| 03:54, 29 சூலை 2023 |  | 1,000 × 700 (7 KB) | RCraig09 | Version 9: centering some text strings . . . making "(July records)" more conspicuous | |
| 15:18, 28 சூலை 2023 |  | 1,000 × 700 (7 KB) | RCraig09 | Version 8: created new graphic for JULY figures.... but only through July 2021 . . . I plan to update when July 2023 data becomes available | |
| 16:47, 15 சூன் 2023 |  | 1,000 × 700 (9 KB) | RCraig09 | Version 7: arrange order of code to make horizontal gridlines appear in front of colored areas | |
| 22:09, 25 மே 2023 |  | 1,000 × 700 (9 KB) | RCraig09 | Version 6: Add blue fill area . . . . simplify horizontal axis | |
| 15:50, 25 மே 2023 |  | 1,000 × 750 (9 KB) | RCraig09 | Version 5: changed dark blue line to dashed line . . . . making read fill-area be under 10-year average (rather than under annual numbers which are not as smooth a trace) | |
| 05:15, 25 மே 2023 |  | 1,000 × 750 (9 KB) | RCraig09 | Version 4: Add 10-year moving averages traces | |
| 18:50, 24 மே 2023 |  | 1,000 × 750 (6 KB) | RCraig09 | Version 3: update to include data through April 2023 . . . . add shading under red trace | |
| 19:31, 2 செப்டெம்பர் 2021 |  | 1,000 × 750 (5 KB) | RCraig09 | Version 2: Amending title to be more descriptive | |
| 19:06, 2 செப்டெம்பர் 2021 |  | 1,000 × 750 (5 KB) | RCraig09 | Uploaded own work with UploadWizard |
கோப்பு பயன்பாடு
பின்வரும் பக்க இணைப்புகள் இப் படிமத்துக்கு இணைக்கபட்டுள்ளது(ளன):
கோப்பின் முழுமையான பயன்பாடு
கீழ்கண்ட மற்ற விக்கிகள் இந்த கோப்பை பயன்படுத்துகின்றன:
- bn.wikipedia.org-திட்டத்தில் இதன் பயன்பாடு
- en.wikipedia.org-திட்டத்தில் இதன் பயன்பாடு
- es.wikipedia.org-திட்டத்தில் இதன் பயன்பாடு
- fa.wikipedia.org-திட்டத்தில் இதன் பயன்பாடு
- ja.wikipedia.org-திட்டத்தில் இதன் பயன்பாடு
- no.wikipedia.org-திட்டத்தில் இதன் பயன்பாடு
- tr.wikipedia.org-திட்டத்தில் இதன் பயன்பாடு